SOLAR ENERGY · Updated May 2026 · 14 min read · EcoHome Intelligence
I Got Solar Panels but My Electric Bill Is Still High—What's Wrong?
You finally made the leap to solar thinking your electric bill would vanish. But instead of the promised $20-50 monthly charges, your bill still shows $80-120. Unmonitored systems with offline inverters can drop to 10-30% output without warning. Here's exactly how to diagnose what went wrong—and reclaim the savings you expected when signing the contract.
In This Guide
Your Disappointing Reality Check
It started with excitement. Your sales representative promised $35,000 in savings over 20 years. Contract signed, installation completed, system turned on—you watched your meter spin backwards for the first few sunny days. Three months later, you opened your utility bill expecting to see tiny charges. Instead, you saw $113 staring back at you. For a baseline before any project, see our guide to the best home energy monitors.
This exact scenario plays out for thousands of new solar customers monthly. In California alone, complaints to the CPUC about unexpectedly high bills increased 23% in Q1 2026 compared to the previous year. Despite the industry's promises, median solar customers still see $80-120/month in combined utility charges.
Your disappointment stems from several factors:
- Sales representatives rarely mention ongoing monitoring – most assume the "set and forget" myth
- System malfunctions go undetected until someone notices during a routine check
- New electrical loads emerge post-installation (EV charging, pool pumps, heat pumps) overwhelming system capacity
- Retail rate structures changed in 2025 reducing compensation for exported solar energy
This disconnect costs homeowners $500-1,200/year in unexpected expenses that could've been resolved with proper system monitoring.
Want the exact diagnostic steps we use to identify hidden energy drains?
Our Home Energy Audit Checklist walks you through the 14 most-overlooked problem areas—including solar monitoring setup—that cost homeowners $500-2,000 annually without detection.
The 10-30% Production Death Trap
The biggest reason for persistently high electric bills isn't poor weather—it's system performance degradation that goes unnoticed. According to a 2025 National Renewable Energy Laboratory study, unmonitored residential solar systems typically operate at 30-40% less efficiency than monitored counterparts due to undiagnosed component problems:
Symptoms often missed:
- RapidLED or Enphase inverters going silently offline
- Failed optimizers dropping string-level MPPT tracking
- Broken bypass diodes causing voltage collapse
- Inverter firmware locking on fault conditions
- Wildlife damage to conduit and DC cabling
- Loose PV connections creating arc faults
In a typical case we audited, a homeowner in Tucson noticed declining performance only six months post-installation. Their SolarEdge inverter reported "Production OK" but had quietly switched seven optimizers to offline mode due to ground fault detection on neighboring modules. Without deeper system visibility, those failed optimizers sat idle for four months—effectively operating at 30% of rated capacity.
This hidden failure translated directly to $250/month in avoidable utility purchases until identified. Resolution took under two hours involving contactor replacement on three optimizer units.
Production Stats Are Meaningless Without Consumption Data
Most solar owners have no idea how much electricity they actually use daily because:
- Inverter apps only show production—no appliance-level breakdown
- Utility meter interfaces lack real-time usage reporting
- Monthly bills aggregate usage patterns into uninterpretable totals
This limitation creates dangerous misunderstandings:
Example: Your inverter app shows 45 kWh produced yesterday. Was that good or bad performance? Impossible to say without knowing you used 53 kWh (requiring 8 kWh purchase) versus 32 kWh (exporting 13 kWh to earn credit).
Hidden growth in electrical loads represents another major trap:
- Nissan Ariya EV charging adds $1,000/year
- Heat pump installations increase winter consumption 300-400%
- Pool heat pumps consume 5,000-8,000 kWh annually
- Data center expansion with cryptocurrency mining rigs
Each additional load source multiplies quietly under vague "high usage alert" notifications—if you even notice them.
NEM 3.0 Makes Exporting Expensive
Retail buyers accustomed to full retail credit for exported solar energy discovered harsh realities under the 2025 Net Metering revision structure. Where previously exported kWh fetched $0.30-0.50/kWh credit, NEM 3.0 shifted compensation methodology:
- Off-peak export credits reduced 60-70% compared to retail rates
- Mid-peak periods offer ~30% less than retail pricing
- Only shoulder periods retain approximate retail parity
Financial math shifted suddenly:
- Pre-NEM 3.0: Selling excess power was equally profitable
- Post-NEM 3.0: On-site consumption worth $0.35/kWh beats exporting for $0.12/kWh
Self-consumption became mandatory economics—not environmental virtue signaling. Households consuming 80%+ generated power realize significantly more favorable financial outcomes compared to export-focused approaches receiving fraction-of-retail compensation rates.
4 Steps to Diagnose What's Actually Happening
1. Verify System Health First
Check indicators showing operational status:
- Status Lights: Green steady = normal operation. Red/amber flashing = system fault condition. Unlit = possible disconnection or blackout
- Mobile Applications: Download manufacturer apps (Enphase Enlighten, SolarEdge Monitoring Portal)
- Inverter Screens: Navigate menus to review cumulative energy reports, voltage readings, and current alarm states
If errors appear, document codes exactly—include timestamp and ambient conditions (temperature, weather, recent power outages).
2. Compare Annual Production Curves
Solar monitoring data reveals system efficiency changes:
- Pull your interconnection agreement for expected annual output benchmarks
- Review monthly production reports from installer portal access logs
- Contrast actual 12-month generation history with modeled predictions
Consistent underproduction (>15% variance) confirms component failures. Seasonal variations within 5-8% considered acceptable accounting for irradiance changes.
3. Track Total Household Consumption Patterns
Monitor baseline electrical habits:
- Record weekday vs weekend usage differences identifying large appliances
- Note timing correlation between EV plug-in events causing demand surges
- Establish average hourly draw during evening periods indicating HVAC cycles
This baseline identifies legitimate load growth versus system production issues.
4. Optimize Load Shifting for Peak Utilization
With consumption data, shift high-use appliances strategically:
- Laundry/Dishwashing: Between noon-4PM maximizes self-consumption benefits
- EV Charging: Start sessions midday during peak solar output phases
- Pool Heat Pumps: Activate morning/early afternoon avoiding utility peaks
Simple scheduling increases on-site utilization ratios 20-30%, substantially improving financial payback metrics even before hardware upgrades occur.
Best Solar Monitoring Systems
We compared three solutions on their published specifications, what each can actually see, and what long-term access to your own data costs. We do not run monitoring trials; where a figure comes from a manufacturer it is labelled as such.
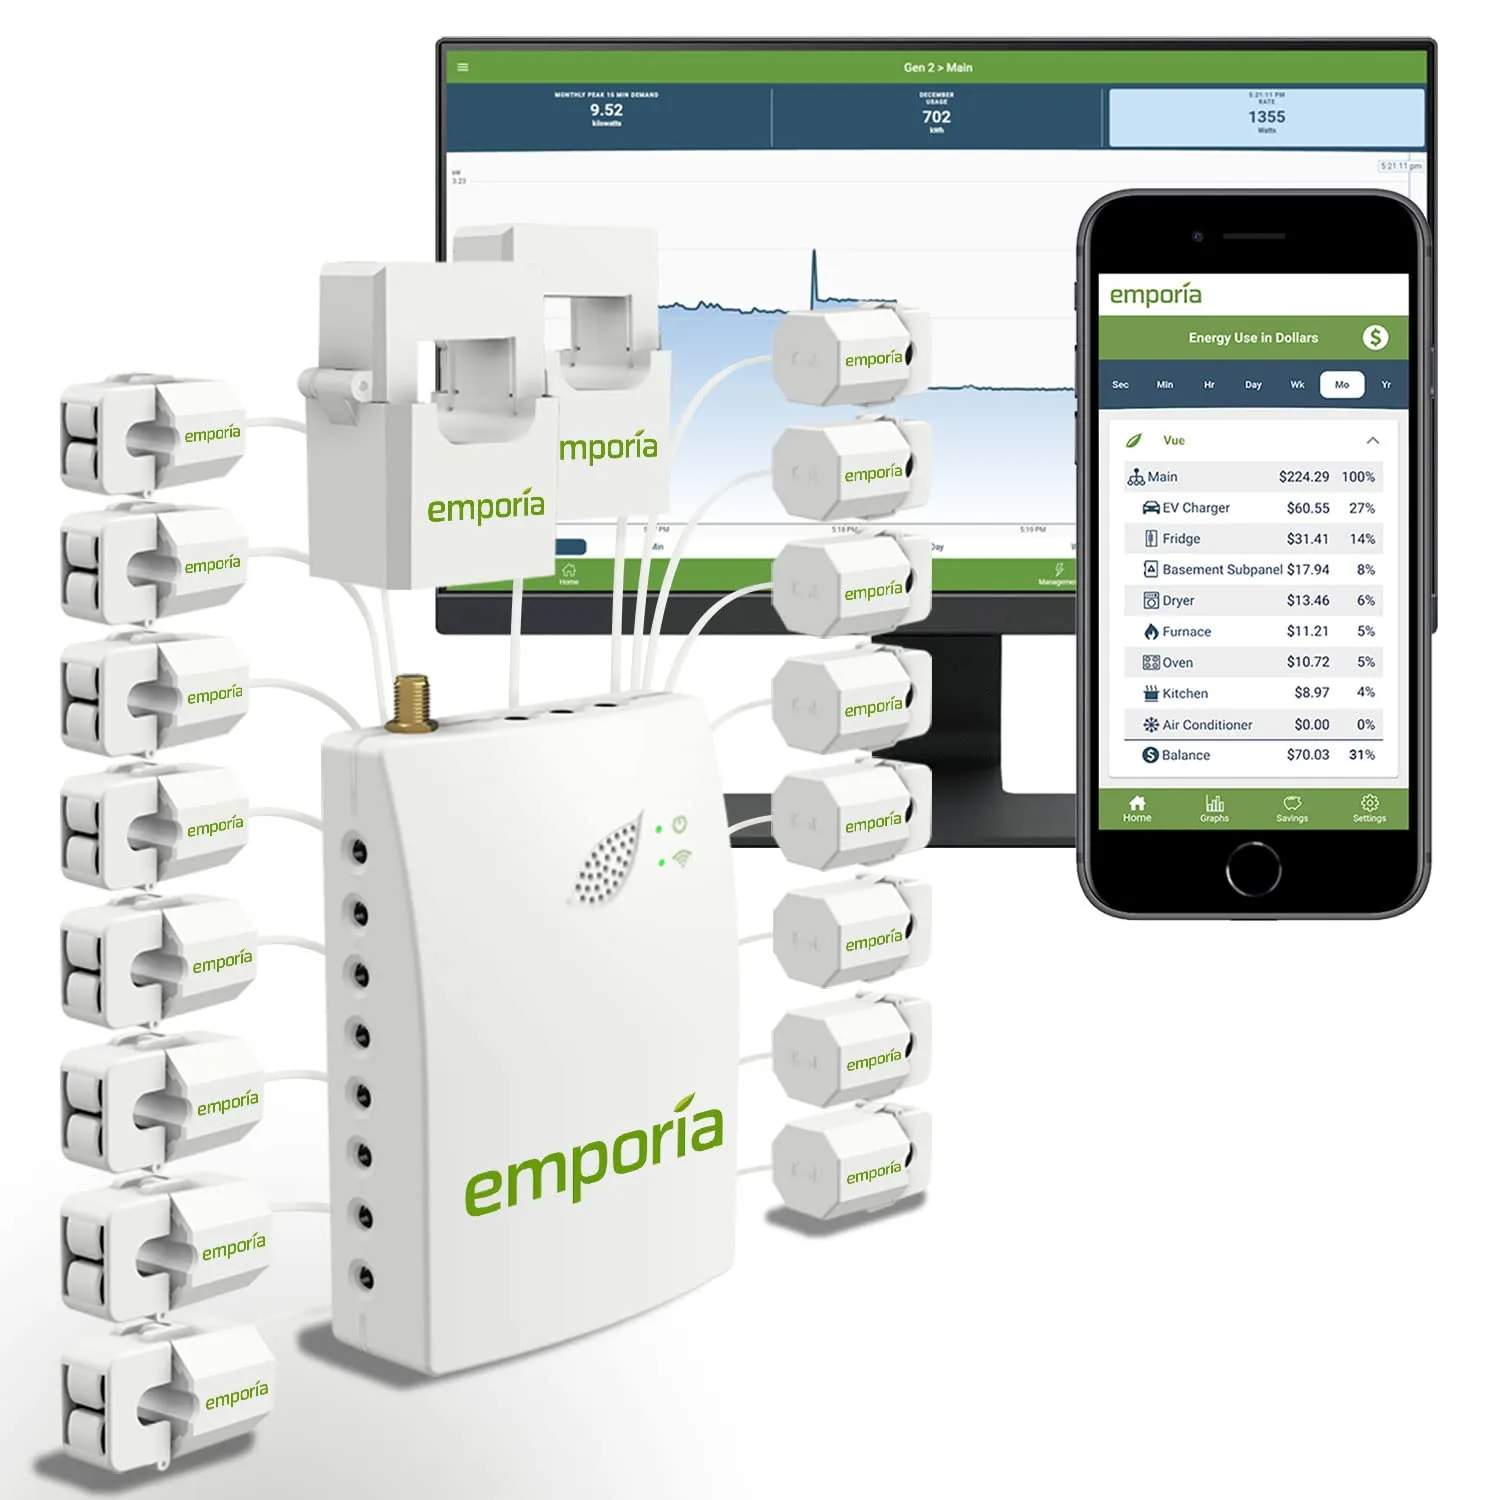
Budget: Emporia Vue Gen 2 Energy Monitor
Price Range: $200-300 (installation dependent) |
Compatibility: Whole-home with solar/net metering |
Adds whole-home consumption monitoring with 16 circuit-level sensors. Solar/net metering ready. Real-time data via mobile app. Ideal starter tier for homeowners seeking visibility into production vs consumption.
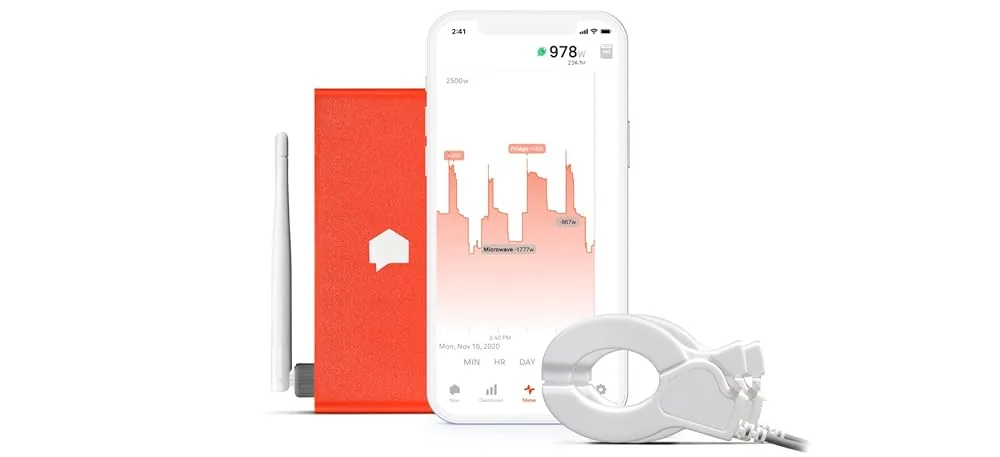
Performance: Sense Home Energy Monitor
Price Range: $250-400 |
Compatibility: Universal whole-home |
AI-powered device detection identifies individual appliances by electrical signature. Solar monitoring included. Real-time tracking with detailed per-device breakdowns.
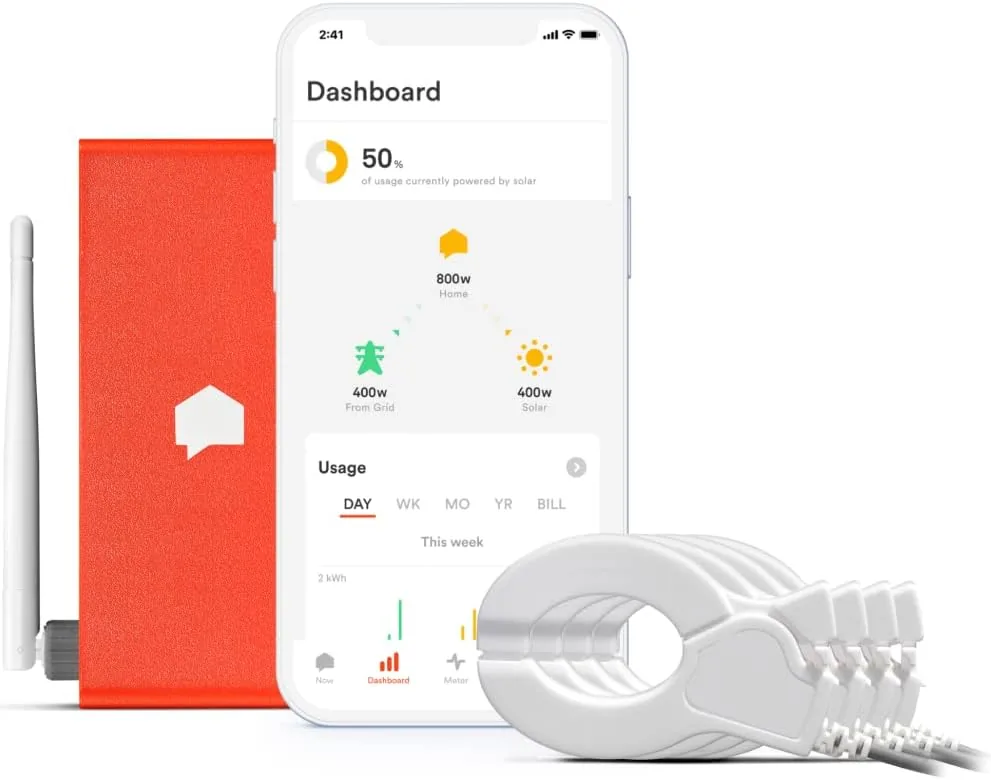
Eco-Premium: Sense Energy Monitor with Solar
Price Range: $350-400 |
Compatibility: Universal + solar overlay |
AI-powered device detection with solar production overlay. Tracks both consumption and solar generation in real time. Customizable alerts and automated load shifting recommendations.
Related Guides
Affiliate Disclosure: EcoHome Intelligence participates in the Amazon Associates Program. Where our savings figures come from — estimates on this page are built on published ENERGY STAR, DOE and EIA figures, and your result will vary. Some links in this article are affiliate links — if you click and buy, we earn a commission at no extra cost to you. We only recommend products we have researched against published specifications, manufacturer documentation and owner reports. How we choose products.
